You don’t need to examine the Aston Villa stats to know that the team have been having a time of it this season. After starting 2025/26 without a win in what felt like forever, their form picked up and they started to pile up the points in the Premier League and the Europa League.
Villa beat Tottenham Hotspur and Manchester City in back-to-back Premier League matches and have clawed their way up the league table. They’ve been getting better, but are they actually getting better? The results are inarguably improved but are they sustainable?
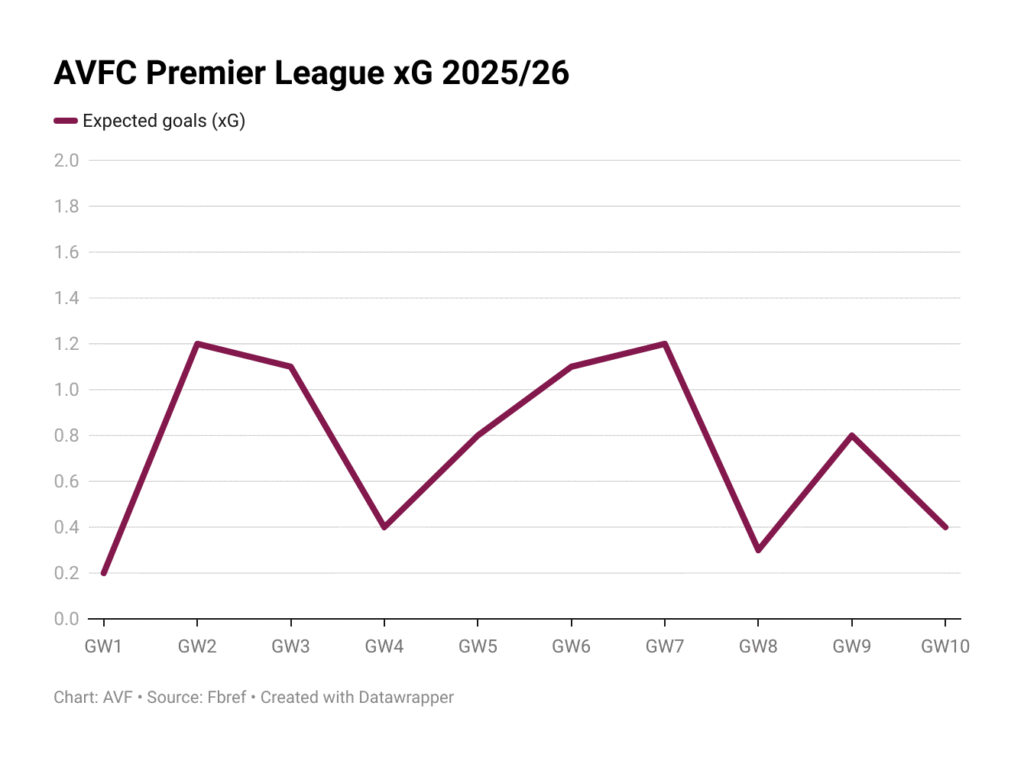
The team’s defending has been very good for the most part but when a team is vastly out-performing its expected goals (xG) value and still scoring too few goals by far, it’s valid to look under the bonnet and look at the attacking machinery in a bit of detail.
Aston Villa stats reveal chance creation problems
Villa are near the bottom of the Premier League rankings for all of these metrics but it would be possible to start very badly, improve a little, and still be playing catch-up.
That’s not what’s happening. Villa’s xG from match to match across the first 10 league matches of the season – broadly, a measure of the combined likelihood of scoring goals based on the statistical quality of chances – hasn’t appreciably increased even as results have improved.
The first thing you see above might be the peaks (week two was Brentford away, by far Villa’s highest-possession fixture against 11 men, and week seven was the home win against Burnley) but they only dipped below 1.0 xG per game nine times last season.
Villa’s xG hasn’t been above 0.8 in any of the last three Premier League matches. Two of the first three matches yielded xG above 1.0 per game.
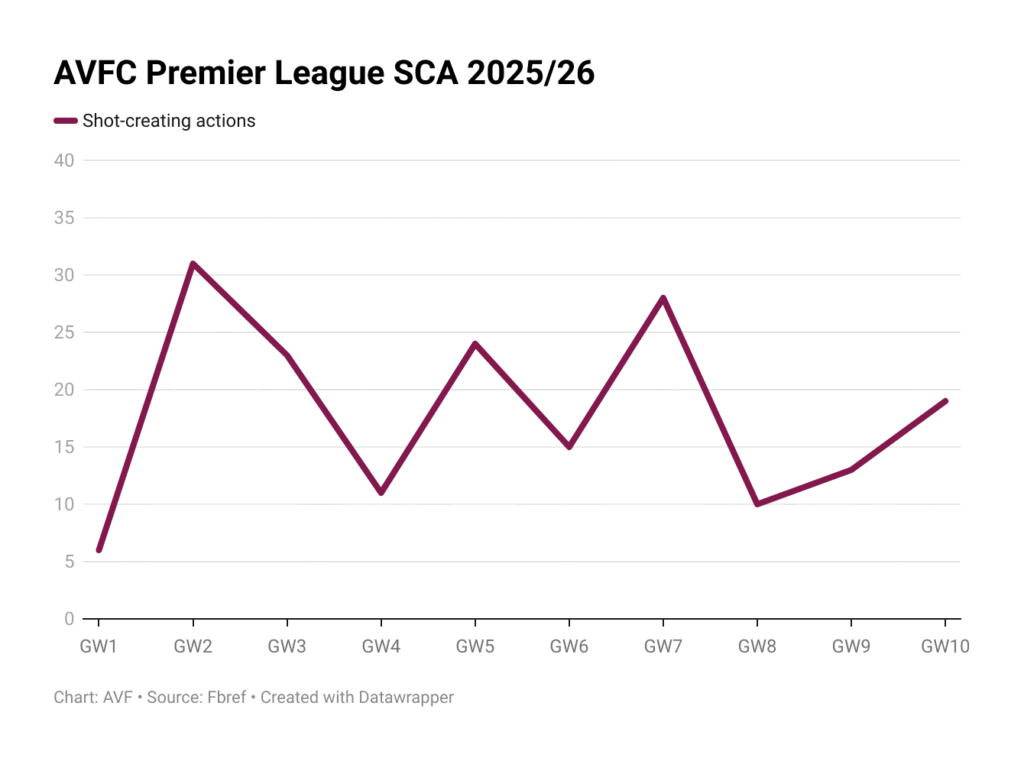
Shot creating actions (SCA) are defined as “the two offensive actions leading directly to a shot” and there are a couple of obvious matches to consider based on the two charts above.
In Villa’s sixth match, their xG was slightly up on the fifth but their SCA dropped to 15. Villa drew game five against ten-man Sunderland and beat Fulham in game six.
In essence, they had many more shots against Sunderland but their efficiency with those shots was much lower.
The most recent game went the other way. Villa had a lower xG against Liverpool than against Manchester City but tallied more SCA, not indicative of much in isolation but Villa’s distance shooters were active at Anfield and came close on a couple of occasions to turning an average shot distance above 22 yards into goals.
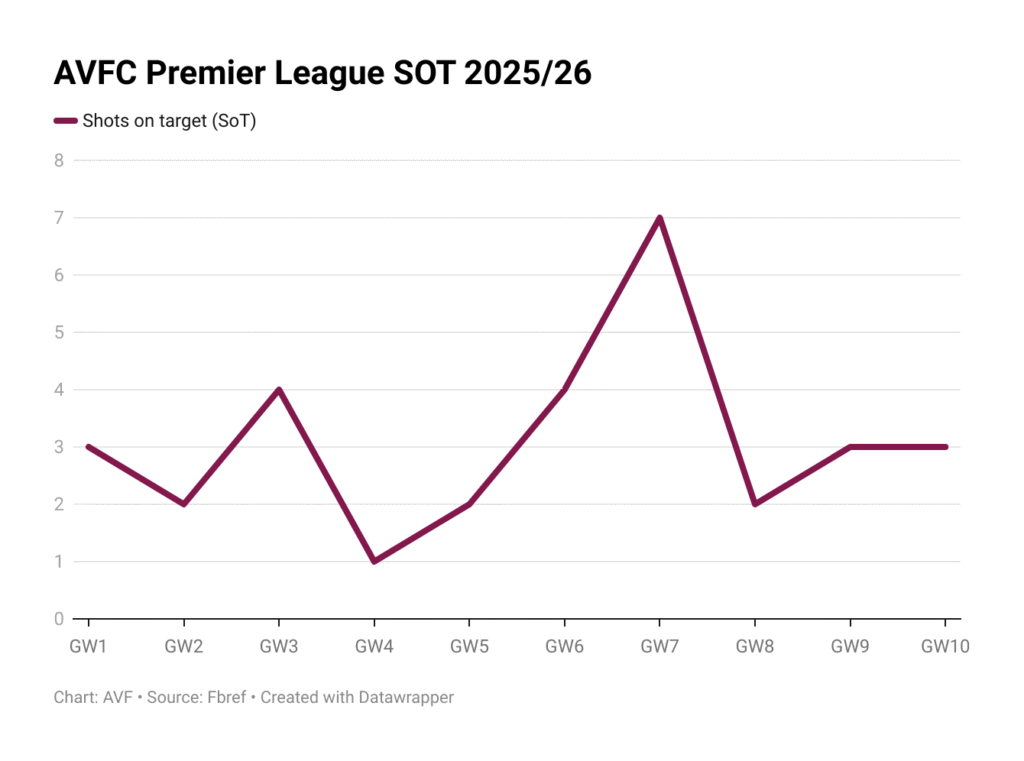
The big spike in Villa’s shots on target evolution this season is the Burnley game, in which Villa hit the target seven times and scored with two of them.
Excluding the first game (every Villa shot was on target that day but there were only three of them) the Burnley win had the highest percentage of shots on target as well as the highest total number of shots.
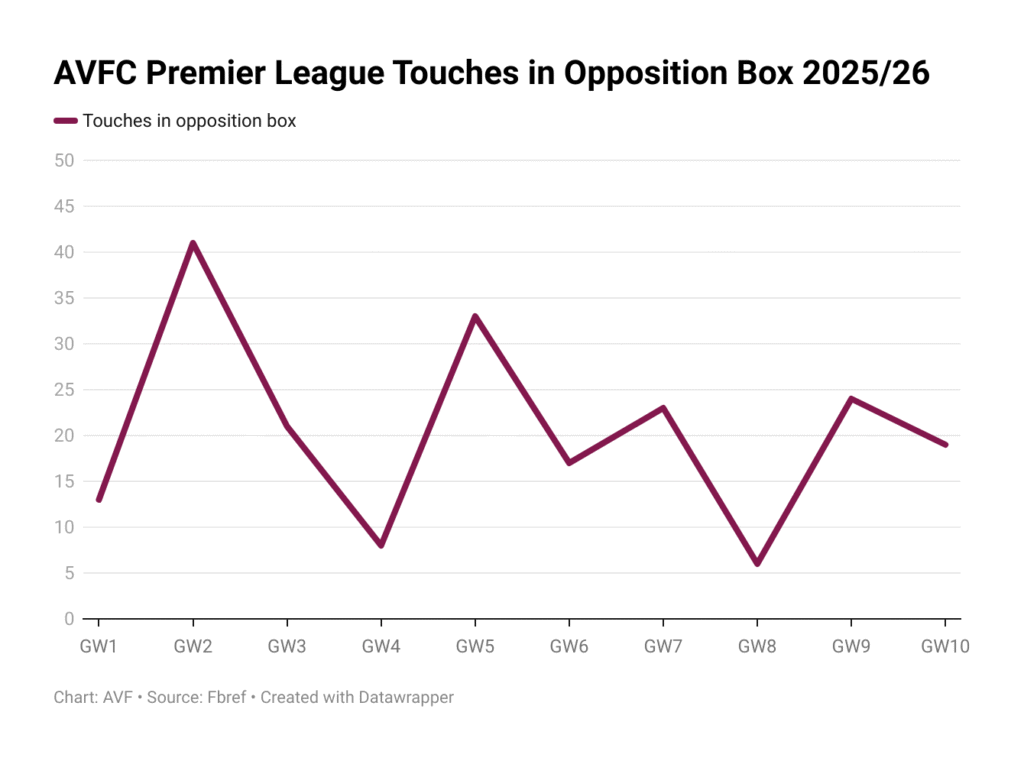
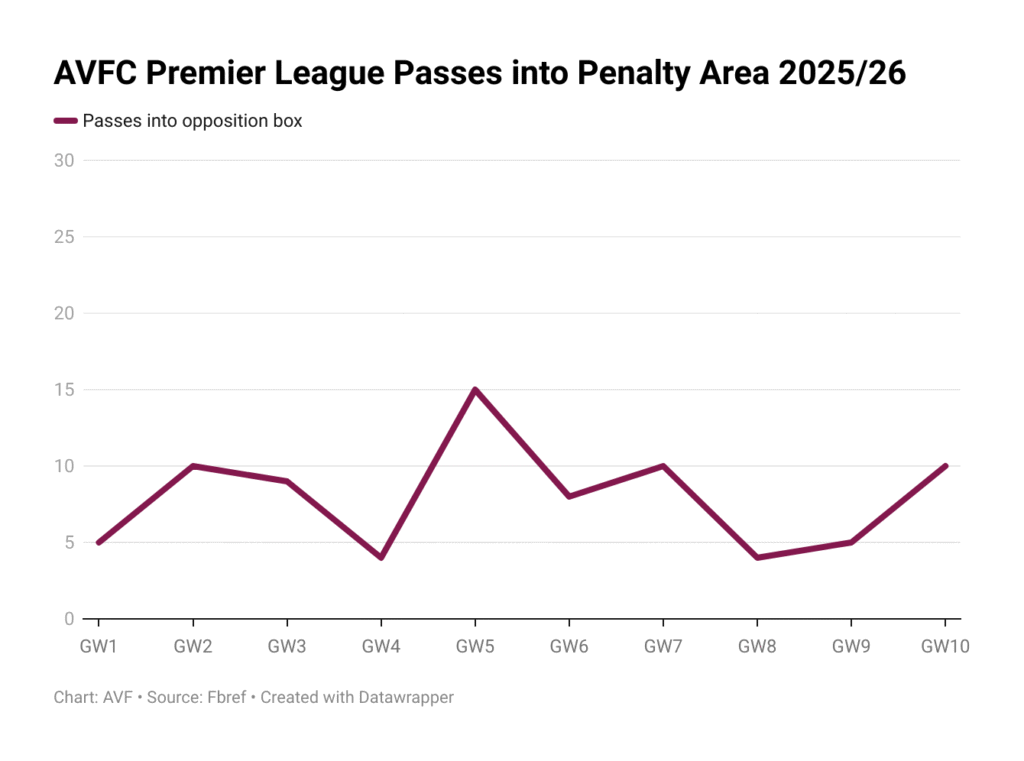
One of the measures by which Villa are showing up poorly compared to their Premier League rivals is the number of touches they’ve had in the opposition penalty area.
Let’s be completely clear on this one: the only thing this metric proves in isolation is itself. Villa aren’t the fifth-worst team in the league above only Burnley, West Ham United, Sunderland and Leeds United, but in combination with the other graphs here it would perhaps be more encouraging if it weren’t a downward curve.
Active attacking threat
Those output curves aren’t indicative of consistent improvement but there’s more to the story than xG and shots on target.
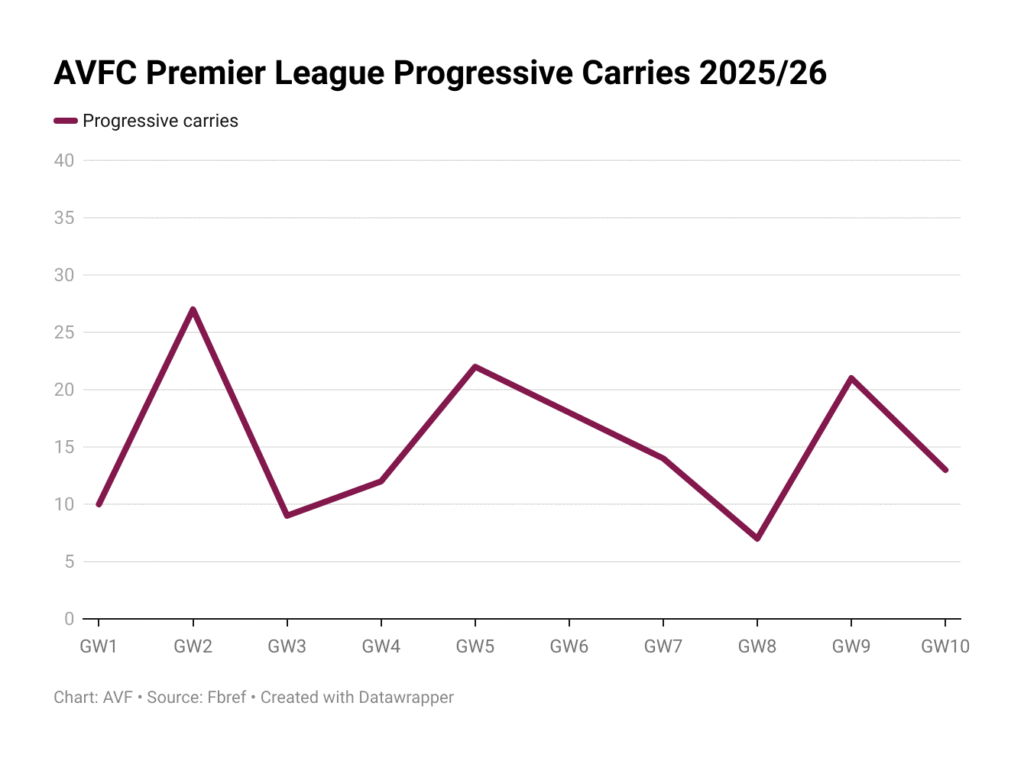
Villa’s progressive carries (runs with the ball that progress it ten yards or more towards the opposition goal) aren’t particularly instructive as an overall trend but the individual peaks are noteworthy.
The first is Brentford away, when Villa went behind in the first half and then amassed an inhumanely huge percentage of possession against a team that understood how their low block would exacerbate Villa’s weaknesses at the time.
The second was against ten-man Sunderland in game five but way over there on the right is the home win against Manchester City. 20+ progressive carries in that match can certainly be interpreted as a big positive whether it was a consequence of being in the lead or just a more incisive performance.
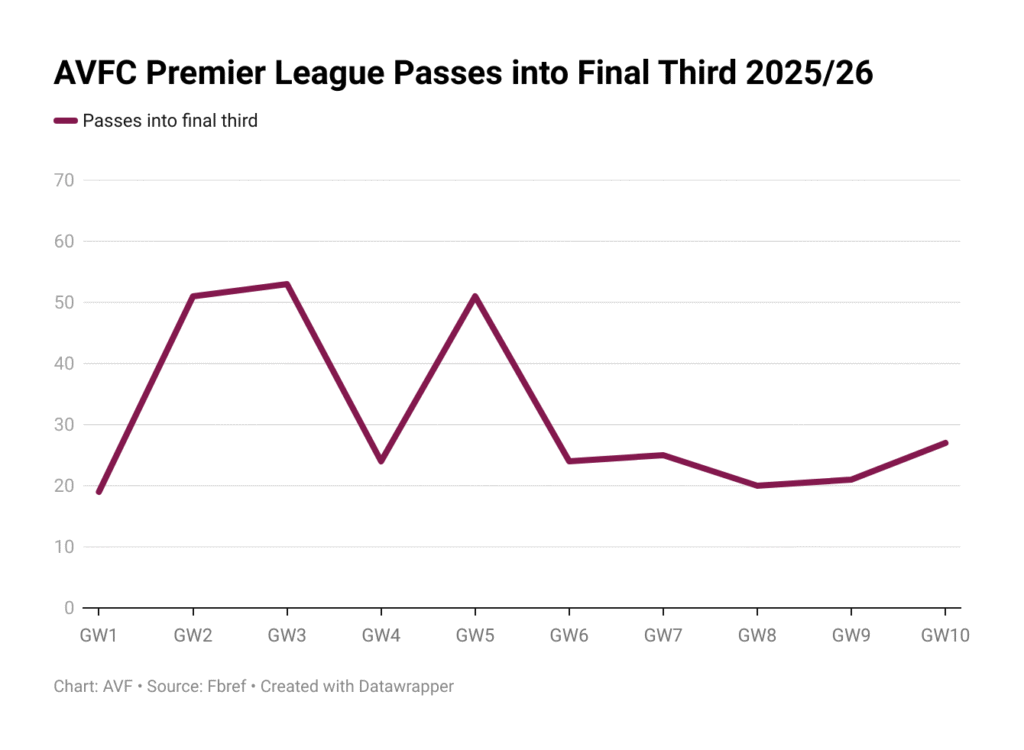
What stands out most from Villa’s passes into the opposition third below is how the lower end of the trend coincides with Villa’s two halves of the season so far.
Match it up with passes into the penalty area, though, and something else emerges.
The analysis across all these Aston Villa stats is naturally affected by the vertical scale but the fact that Villa’s highest rate of passes into the attacking third was at the start of the season and didn’t translate into passes into the penalty area hints, I think, at a characteristic of Villa’s worst performances.
There have been times this season when Villa have found it easy to get into the opposition half and indeed the attacking third but have broken down from there. I thought that was the case against Maccabi Tel Aviv in the Europa League, for starters.
That pronounced little kick up from Spurs to Man City to Liverpool? That’s good stuff happening. You know, maybe. Hopefully.
So what?
We’re more than a quarter of the way through the Premier League season but 10 matches do not a conclusive Aston Villa stats sample make. I would not claim these numbers and patterns to be statistically representative because (a) they’re not and (b) I wouldn’t know what that looked like anyway.
It can’t be ignored that Villa’s attacking numbers here are honking across the board and the eye test backs that up so far. Improvement is still needed, but it’s more important to hit the opposition where it hurts if they can be specific about it.
Seeing some positive signs in that context in the last four or five matches is a step in the right direction and those baby steps have come in the second phase of the fixture list against top-level opposition.
If there’s a question mark over whether the first three or four games were the blip or the next five or six, whether the results will deteriorate in line with attacking data or attacking data will straighten out, there’s reason to believe it’ll be the latter.
The post Aston Villa started the season badly and these worrying Premier League stats cast doubt over their improvement appeared first on AVillaFan.com – Aston Villa Fan Site.